
View and use statistics dashboards
How to create and customise statistics dashboards.
1. Statistics Dashboards: See the Bigger Picture, Instantly
Behind every successful event is one key ingredient: visibility.
Your statistics dashboards give you a clear, real-time view of how your event is performing — registrations, trends, and key indicators all in one place.
No spreadsheets to export. No manual calculations. Just the information you need, when you need it.
Because better visibility means better decisions — and smoother editions.
2. How to create a Statistics Dashboard
Install the ‘Statistics dashboards’ module from the Store.
2.1 Create your first stats dashboard
In your edition, go to Statistics dashboards > Add a statistics dashboard.
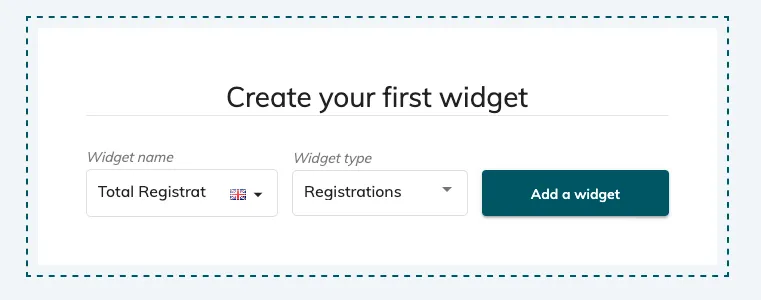
You’ll be prompted to add your first widget, add the name and the widget type.
2.2 General settings
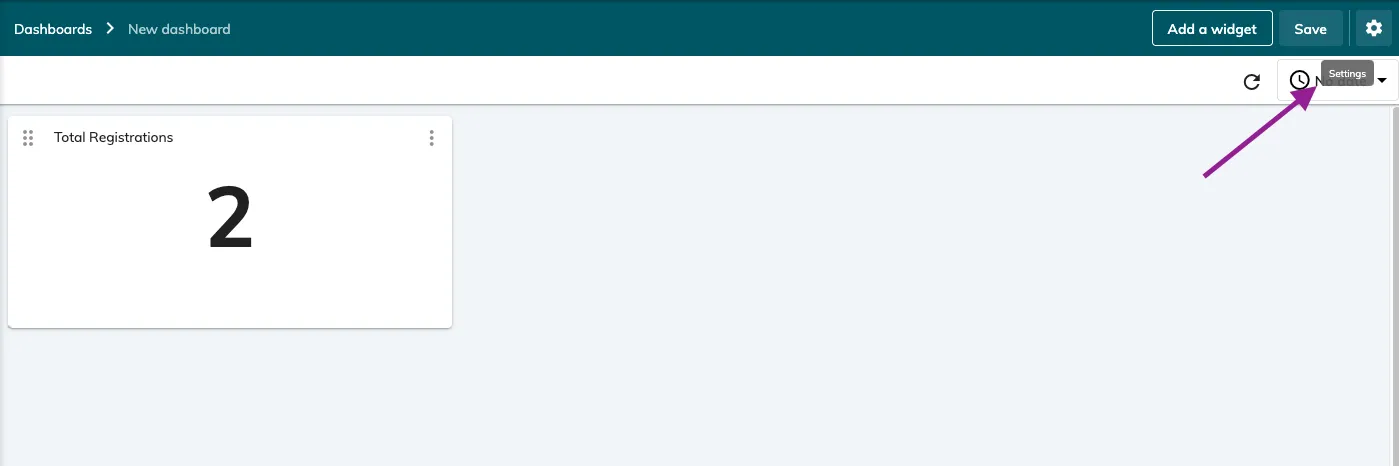
Click on the settings button top right to edit the general settings of your dashboard.
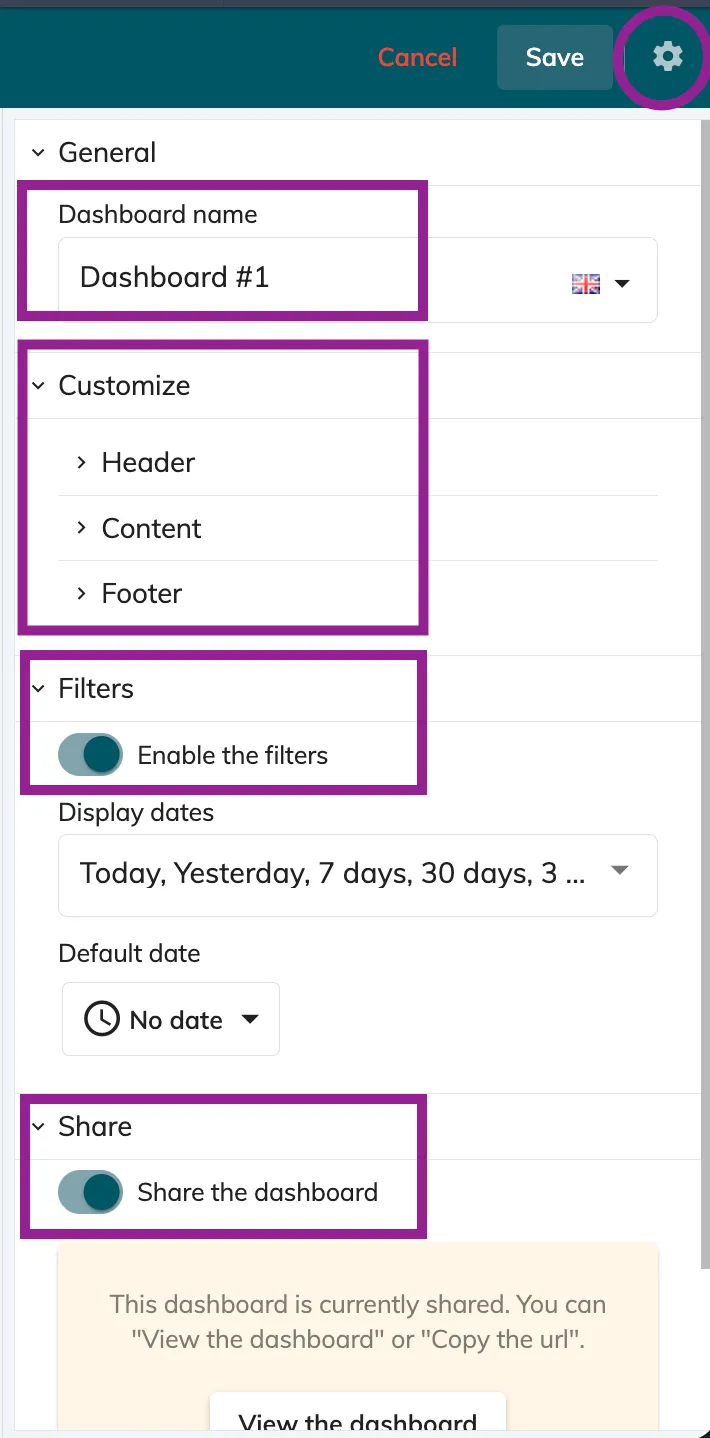
Here, you can:
-
name your dashboard
-
customise the height and background colour of your header and footer, you can also upload an image to be shown in each.
-
customise the background colours of your content block
-
enable filters
-
choose to create a shareable public URL
2.3 Adding widgets to your dashboard
Click on Add a widget to add widgets.
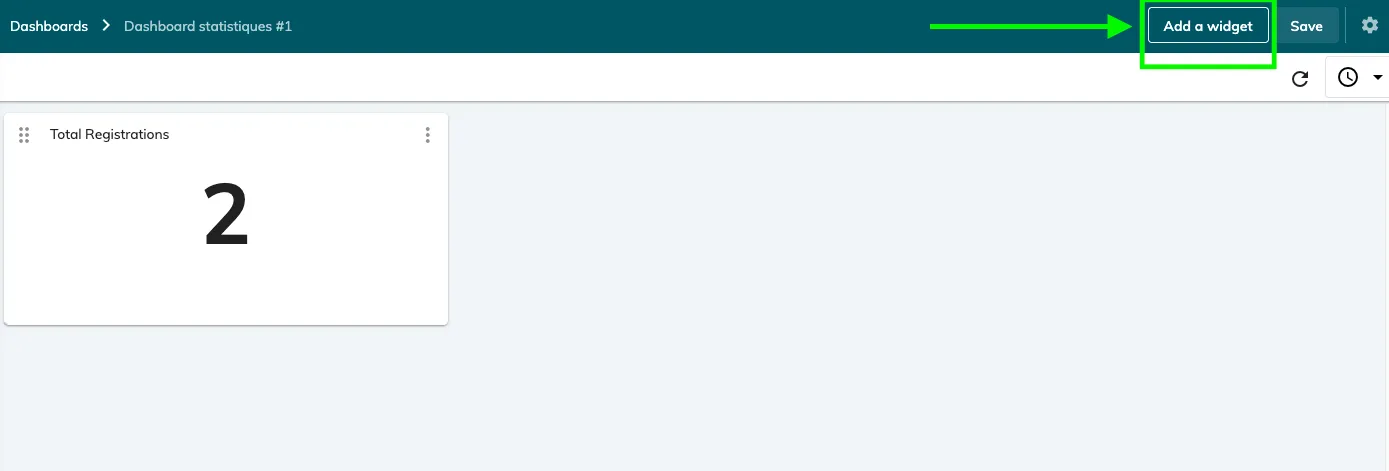
Name your widget, add content (optional) and select the widget type.
Depending on the widget type you chose, you’ll be able to select the criteria (the form field to base the widget on) in the ‘Settings’ section.
These form fields types can be selected as criteria:
-
radio button
-
select
-
multiselect
-
checkbox
-
country
-
nationality
In the ‘Advanced parameters’ you’ll be able to filter by competition and/or tags. If no competition is selected, data from all the competitions combined will be displayed.
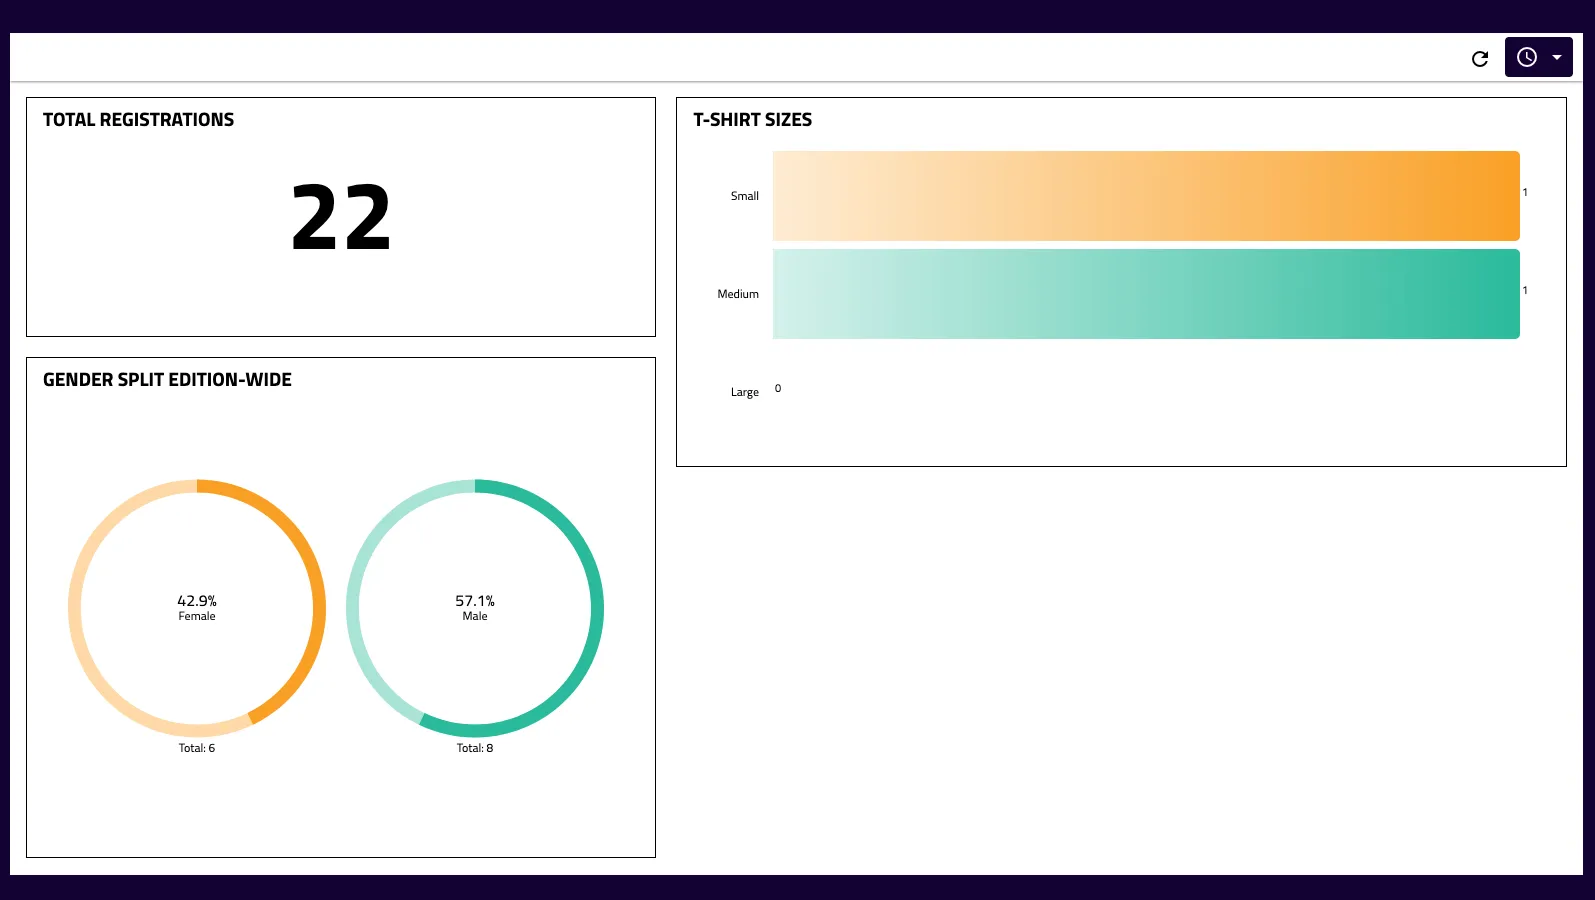
Each widget can be resized and moved within the dashboard.
2.4 Useful information
Only registrations are taken into account in the statistics (applications, waiting list, prepaid places, deleted, cancelled… are not taken into account).